According to Brake, one in four 18-24-year-olds (23%) crash within two years of passing their driving test. Our internal driving data of nearly 5 billion miles also shows that new drivers are 3 times more likely to crash in the first three months of their policy compared to the last three months1.
It takes time to get comfortable with driving – lack of experience is one of the main reasons why young drivers are at risk on the road. Young people are known to be over-confident when it comes to many things, so they’re usually more likely to take risks when driving.
At insurethebox we’re strong believers in assisting young drivers – road safety is at the heart of everything we do. We use the latest telematics technology to help our customers improve their driving whilst earning rewards for safe behaviour on the road.
>> Get a quote with insurethebox here.
From speeding alerts and safety campaigns to a personalised online portal, the black box fitted to a customer’s car allows us to support them on the journey to become better drivers. In fact, analysis by LexisNexis showed a correlation between the increase in telematics services and a 35% reduction in road casualties of 17-19-year-old drivers.
The telematics data not only directly helps the driver but gives us invaluable insights about young driver behaviour.
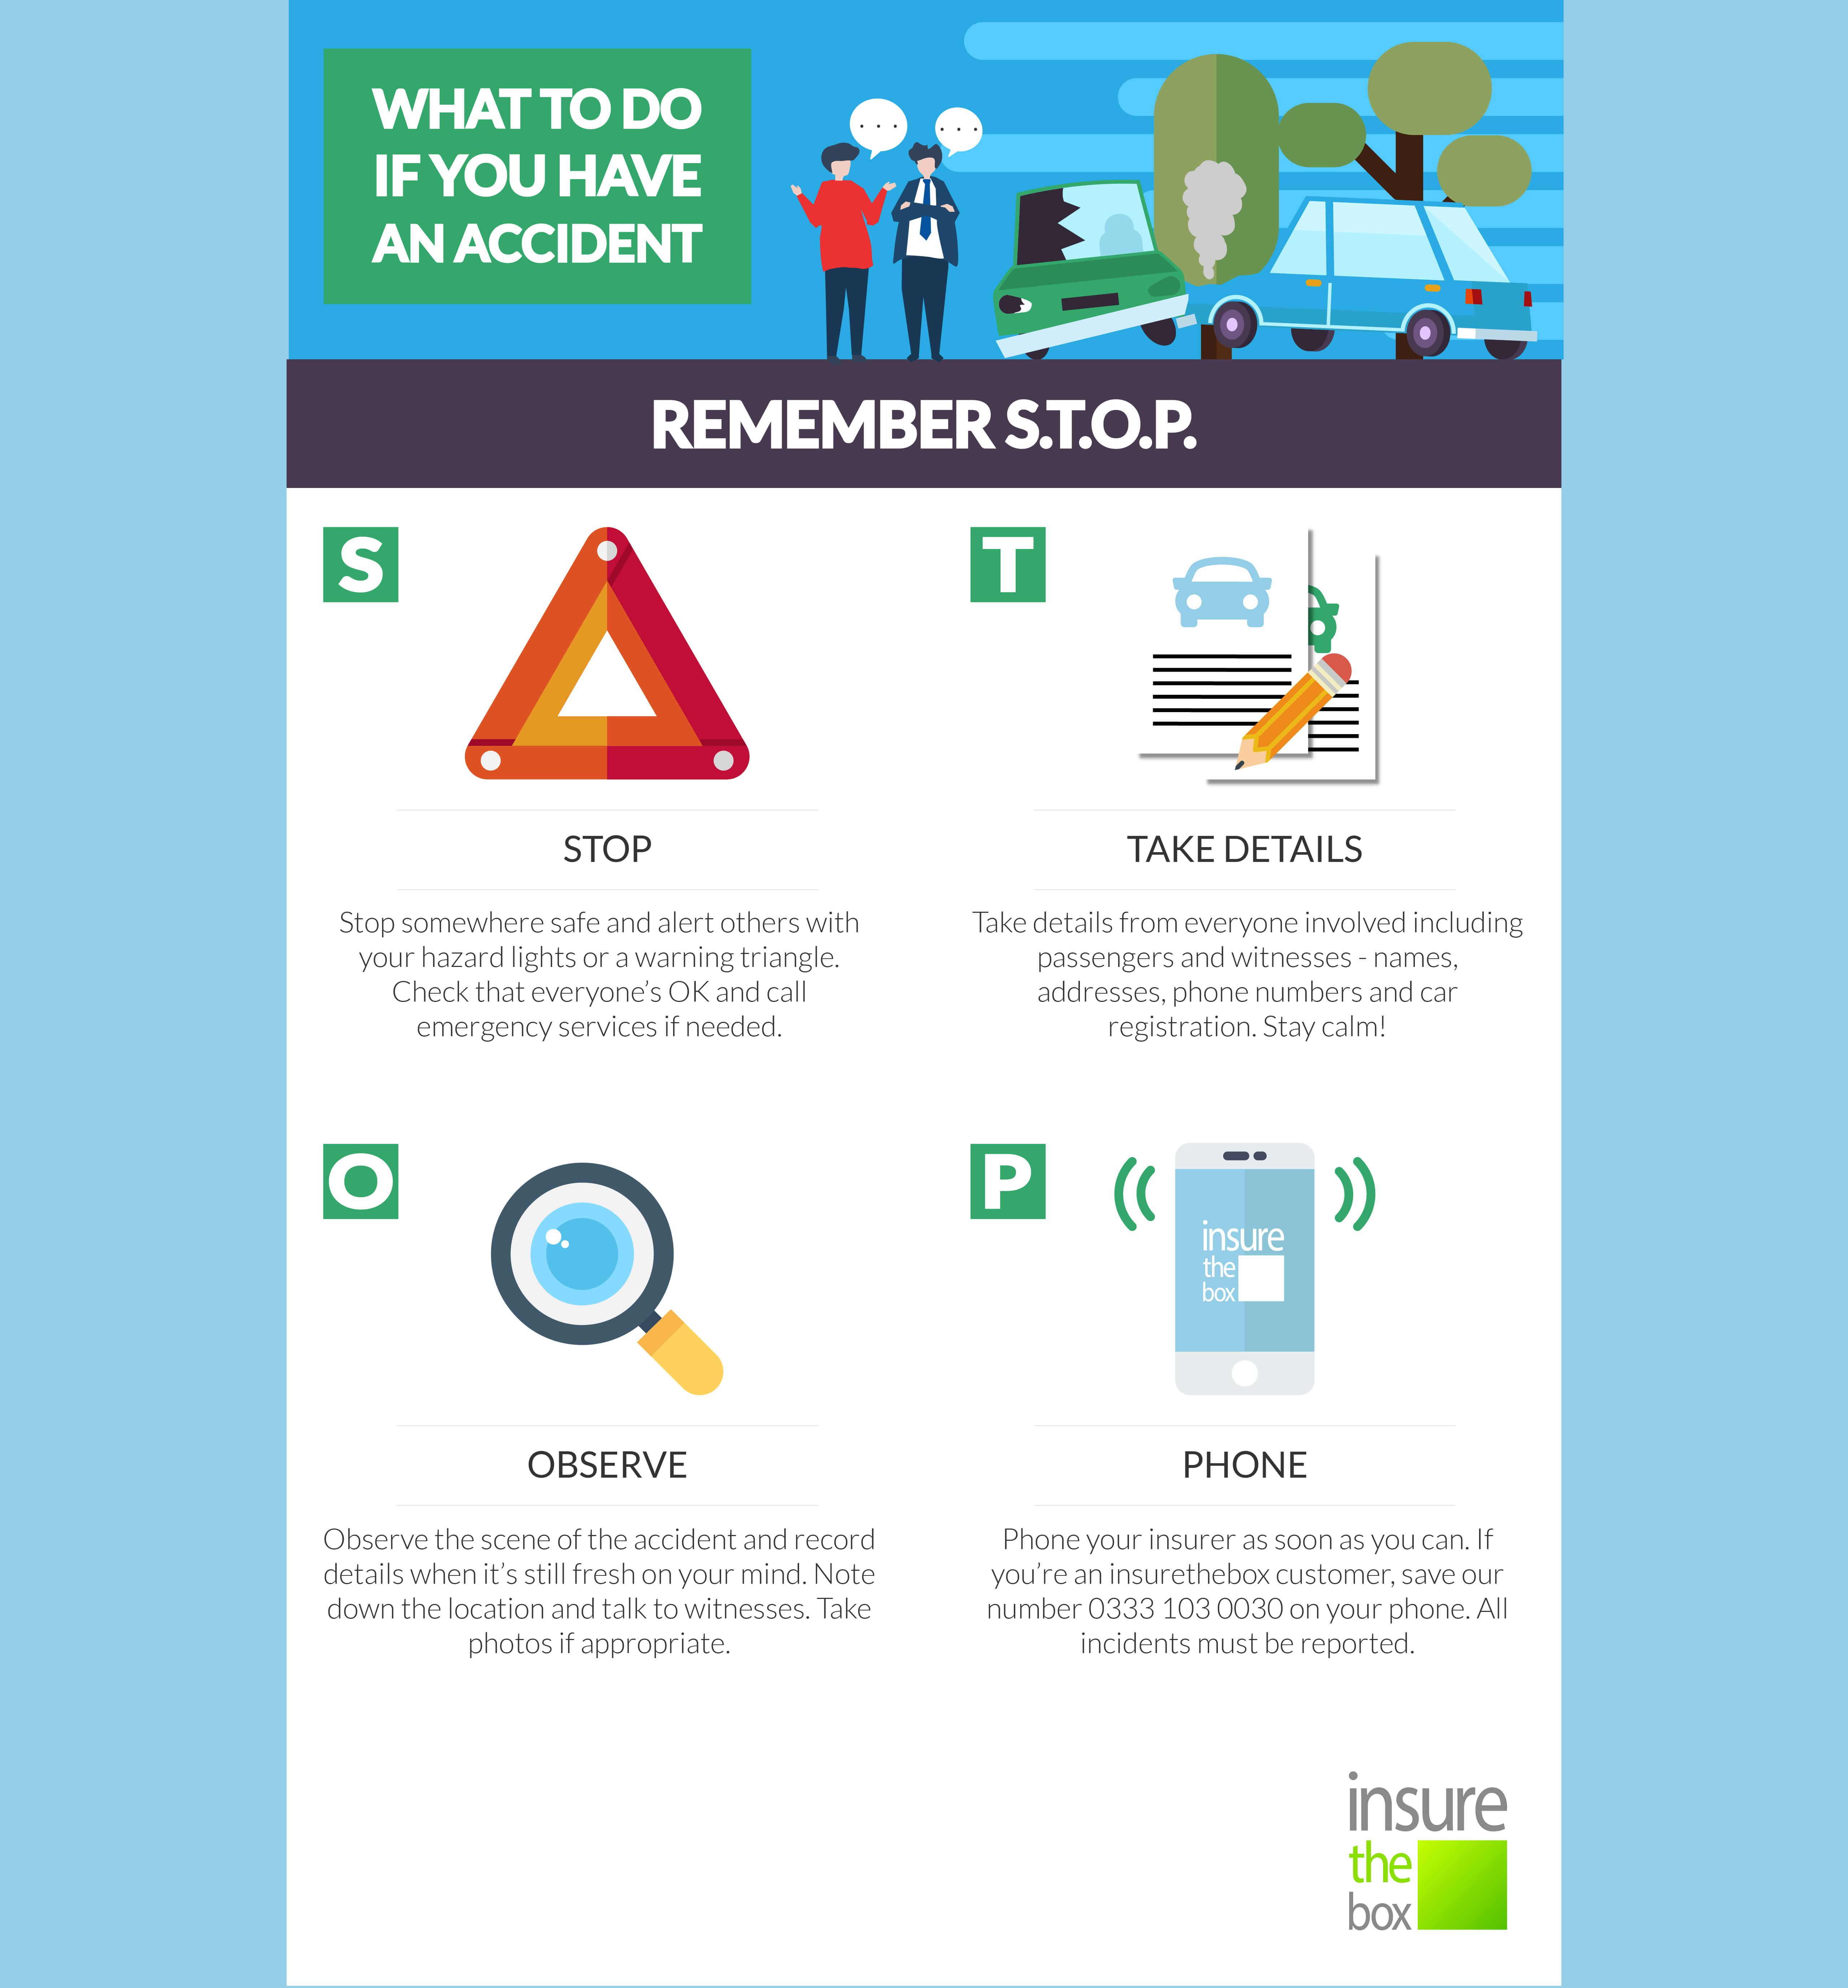
Before we look at what we’ve learned, make sure you know what to do if you’re in an accident.
So, here are some key things we’ve learned:
Most accidents happen in the early evening
Government data2 shows that the number of accidents is the highest between 4pm and 6pm. Our customer data supports this too – most incidents reported to us happen at 5pm4.
…But driving at night is more dangerous
Nighttime driving is known to come with more risks – our data shows that young drivers who speed between midnight and 7 am are 3 times more likely to have an accident than drivers who speed during the day3.
Government data2 further demonstrates that the severity of accidents increases between midnight and 6 am.
>> Check out our tips for driving at night.
Most accidents are rear-end collisions or happen at T junctions
Most claims reported to us come from rear-end collisions4. This happens when a car crashes into the one in front of it; usually as a result of driver distraction, tailgating or bad traction due to wet weather conditions.
Another common reason for claims made is collisions at T junctions4. Drivers don’t often take the time to observe the road they’re joining or when they’re pulling out from a road.
>> Learn how to drive in wet weather conditions.
Most accidents happen on Fridays
Based on our internal driving data Friday ranks as the most likely day to have an accident4. And what’s spooky is that you’re 12% more likely to crash on a Friday when it falls on the 13th4!
It’s probably the rush to enjoy the weekend – our customers drive more on Fridays and Saturdays than any other days5, though, government data shows that the accident is more likely to be fatal on a Sunday2.
Most severe/fatal accidents happen in rural roads
Data from the Department of Transport also reveals that the number of slight accidents is much higher in urban areas but most severe or fatal accidents happen in rural roads2.
>> Get some tips from us for driving on country roads.
Most accidents happen in the winter months
The clocks go back, making it suddenly darker to drive home in the evening, and the driving conditions change with colder weather, making winter a more dangerous season to drive.
According to government data, the highest number of accidents in the UK happens in November2. Based on claims made by our customers the highest number of accidents happen in January6 – but we’ve also detected that there is a 12% increase in accident propensity between October and November7.
> Learn how to drive in snow and ice.
Sources:
1 Analysis of NCD and claims data of new ITB customers June 16 – May 17.
2 Analysis on all UK drivers in 2016 by the Department of Transport: https://data.gov.uk/dataset/cb7ae6f0-4be6-4935-9277-47e5ce24a11f/road-safety-data.
3 Analysis of speeding and time of day for new ITB customers 2014, 2015 and 2016.
4 Analysis of all claims made; all ITBL customers since 2015.
5 Analysis of miles drive by ITB customers between 2014- 2017.
6 Analysis of all claims made; all ITBL customers since 2013.
2 Comments
Comments are closed.
Very educational. Any advise that you can provide is very welcome.
Many thanks
Thanks for your feedback Maria! You can view all of our blogs and driving tips here: https://www.insurethebox.com/category/safer-driving-blog/